

Here’s a hard truth: most businesses are bleeding money on Google Ads because they’re tracking the wrong numbers.
I’ve seen it happen countless times. A business owner proudly shows me their campaign with thousands of impressions and hundreds of clicks, wondering why their bank account doesn’t match the excitement. The problem? They’re measuring activity instead of results.
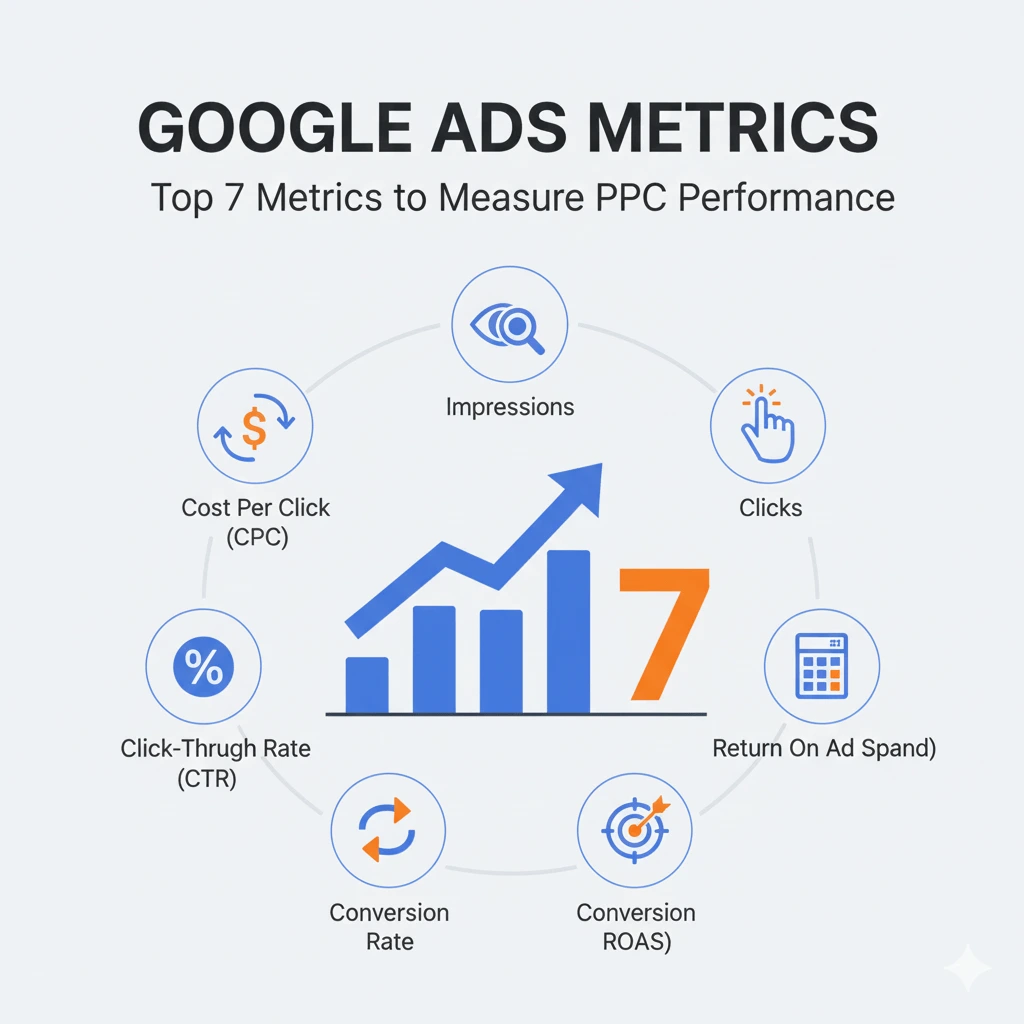
Google Ads metrics are the compass that guides your PPC campaigns. Without them, you’re basically throwing money at Google and hoping something sticks. In this guide, I’ll walk you through the 7 key PPC metrics that actually move the needle for your business.
What Are Google Ads Metrics?
Google Ads metrics are the data points that tell you how your campaigns are performing. Think of them as your campaign’s vital signs – they show what’s working, what’s broken, and where your money is going.
But here’s where most people get it wrong. Not all metrics are created equal.
There are vanity metrics – the ones that look impressive in reports but don’t pay the bills. Impressions and clicks fall into this category. Sure, they’re important to track, but they don’t tell you if you’re making money.
Then there are performance metrics – the real heavy hitters. Conversions, return on ad spend, and cost per acquisition actually show whether your campaigns are profitable. These are the Google Ads metrics that keep your business in the black.
The Top 7 Google Ads Metrics You Must Track
1. Click-Through Rate (CTR)
Your CTR is simple maths: divide your clicks by your impressions, and multiply by 100 to get a percentage.
This metric matters because it tells Google whether people actually want to see your advert. A high CTR signals that your advert is relevant, which improves your Quality Score and lowers your costs. It’s like getting a discount for being good at your job.
Industry benchmarks vary wildly. Search adverts typically see 3-5% CTR, whilst display adverts hover around 0.5%. If you’re in legal or dating industries, expect higher competition and different benchmarks.
Low CTR? Your advert copy probably isn’t speaking to what people are actually searching for. Time to rewrite.
2. Quality Score
Quality Score is Google’s report card for your adverts, graded from 1 to 10. Google calculates it based on three factors: your expected CTR, advert relevance, and landing page experience.
Why should you care? Because Quality Score directly impacts how much you pay per click and where your adverts show up. A high Quality Score can cut your costs in half whilst putting you above competitors who are paying more.
Improving it isn’t rocket science. Write adverts that match your keywords, send people to landing pages that deliver what you promised, and maintain a solid CTR. Do these things
3. Conversion Rate (CVR)
Your conversion rate shows the percentage of clicks that turn into actual business results – leads, sales, sign-ups, whatever matters to you.
The formula is straightforward: divide conversions by clicks, multiply by 100.
This is where the rubber meets the road. You can have all the clicks in the world, but if they’re not converting, you’re just paying for window shoppers. A strong conversion rate means your landing page and offer are doing their job.
Most industries see conversion rates between 2-5% for search campaigns. If you’re below that, your landing page needs work. Make sure it loads fast, matches your advert’s promise, and makes it dead simple for people to take action.
4. Cost Per Conversion (CPA)
CPA tells you exactly how much you’re paying to acquire a customer or lead. Calculate it by dividing your total advert spend by the number of conversions.
Here’s why this metric is crucial: you can have a low cost per click and still lose money if those clicks don’t convert. CPA shows you the real price of acquisition.
Let’s say you’re spending £500 on keywords that generate 10 conversions – that’s £50 per conversion. If another keyword costs £300 and generates 15 conversions, that’s only £20 per conversion. Even though you’re spending less on the first keyword, the second one is actually more profitable.
Track CPA at the keyword level. You’ll quickly spot which keywords are goldmines and which ones are money pits.
5. Return on Ad Spend (ROAS)
ROAS is the ultimate “am I making money?” metric. The formula is simple: divide your revenue by your advert spend.
If you spend £1,000 on adverts and generate £4,000 in revenue, your ROAS is 4:1 or 400%. For every pound you spend, you’re making four back.
This metric is especially critical for e-commerce campaigns where you can track exact revenue numbers. Most profitable campaigns aim for at least 4:1 ROAS, but your target depends on your profit margins and business model.
A subscription business with high lifetime value might be fine with 2:1 ROAS initially, knowing they’ll profit over time. A retailer with thin margins might need 8:1 just to stay afloat.
6. Impression Share
Impression Share shows what percentage of available impressions you’re actually capturing. If your Impression Share is 40%, that means your adverts are showing up for 40% of eligible searches – and your competitors are grabbing the other 60%.
This metric reveals missed opportunities. Low Impression Share means potential customers are seeing your competitors instead of you.
There are two main reasons you lose Impression Share: budget and rank. If you’re losing due to budget, you need to spend more. If it’s rank, you need to improve your Quality Score or increase your bids.
Check this metric regularly. It’s like watching competitors steal customers right in front of you – but with the power to do something about it.
7. Top Impression Rate
Google retired the old “average position” metric, but they replaced it with something better: Top Impression Rate and Absolute Top Impression Rate.
Top Impression Rate shows how often you appear anywhere in the top adverts above organic results. Absolute Top Impression Rate shows when you’re the very first advert people see.
These metrics matter because visibility drives results. Adverts at the top get more clicks and conversions than adverts buried at the bottom. If your Top Impression Rate is low, you’re not competing effectively for the most valuable advert real estate.
Improve these rates by increasing bids on your best-performing keywords and boosting your Quality Score.
Bonus Metrics Worth Monitoring
Don’t stop at the top seven. Keep an eye on these supporting metrics too.
Cost Per Click (CPC) shows your average cost for each click. Whilst it’s not the be-all-end-all, it helps you understand your spending patterns and spot unusual spikes.
Search Impression Share Lost tells you specifically why you’re losing impressions – whether it’s budget constraints or low advert rank. This diagnostic insight helps you fix the right problem.
Customer Lifetime Value (LTV) from PPC campaigns shows the long-term profitability of your paid customers. You might be willing to pay more for acquisition if you know these customers stick around and spend more over time.
How to Track Google Ads Metrics Effectively
Tracking these metrics isn’t complicated, but you need the right setup.
Start with the Google Ads dashboard. It’s your home base for campaign performance. Customise your columns to show the metrics that matter most to your business. Don’t clutter it with vanity metrics you’ll never use.
Link your Google Ads account with Google Analytics (GA4). This connection reveals what happens after people click your adverts. You’ll see bounce rates, time on site, and conversion paths that Google Ads alone can’t show you.
For serious tracking, build custom dashboards in Looker Studio (formerly Data Studio). Pull data from multiple sources, create visualised reports, and automate the whole thing so you’re not manually pulling numbers every week.
Establish a regular reporting cadence. Check daily for major issues, review weekly for optimisation opportunities, and do deep dives monthly to spot trends and make strategic decisions.
Common Mistakes Marketers Make with PPC Metrics
The biggest mistake? Obsessing over clicks whilst ignoring conversions. Clicks feel good and they’re easy to generate, but they don’t pay your bills.
Another killer mistake is ignoring Quality Score. It’s literally Google telling you how to save money and get better results, yet marketers often treat it like an afterthought.
And here’s one that catches businesses by surprise: not tracking phone calls or offline conversions. If customers ring you after seeing your advert, that’s a conversion. If they visit your shop, that’s a conversion. Set up call tracking and offline conversion imports, or you’re flying blind.
Conclusion
Tracking the right Google Ads metrics transforms your PPC campaigns from expensive experiments into profit-generating machines. Focus on these seven key metrics – CTR, Quality Score, Conversion Rate, CPA, ROAS, Impression Share, and Top Impression Rate – and you’ll make smarter decisions with every pound you spend.
The difference between successful PPC campaigns and money pits usually comes down to measurement. Now you know what to measure and why it matters.
Ready to take your Google Ads performance to the next level? Audit your current campaigns against these metrics and identify where you’re leaving money on the table. Or if you’d rather have experts handle it, let’s talk about managing your PPC campaigns for maximum ROI.